AFE Leaks
View Plans

Real-World Well Cost Intelligence

Benchmark capital costs, analyze completion designs, and evaluate Lower 48 strategy using AFEs/Actuals from 99,000+ wells.

Trusted by operators across the Lower-48

Interactive Tools and API Access 100,000+ Wells Tracked Daily Updates

Trusted by Industry Leaders

100,000+
Wells with cost data
$400B+
Total capex tracked
9
States included
1600+
Operators analyzed

Everything you need to benchmark well costs

From high-level benchmarking to detailed cost breakdowns, AFE Leaks gives you the data and tools to make informed decisions.

Basic Plan
📊

Benchmarking

Compare well costs and performance across operators, regions, and time periods. Available with Basic subscription.

  • • Cost per foot analysis
  • • Operator comparisons
  • • Regional benchmarking
  • • Time series analysis
Start benchmarking
Premium Plan
📈

Benchmarking Plus

Advanced benchmarking with detailed component analysis and interactive visualizations.

  • • Component-level cost breakdown
  • • Interactive charts and maps
  • • Advanced filtering options
  • • Export capabilities
Advanced benchmarking
Premium Plan
🔍

Well Explorer

Comprehensive single-well analysis with detailed cost, production, and completion data.

  • • Complete well history
  • • Cost breakdown analysis
  • • Production curves
  • • Completion details
Explore wells
Premium Plan
📈

AFE Economics

Advanced economic analysis with type curve modeling, cash flow forecasting, and comprehensive financial metrics for AFE's in our coverage.

  • • Type curve development
  • • Arps decline analysis
  • • Cash flow modeling
  • • PV-10, PV-20, PV-30, IRR
Run economics
Premium Plan
💰

Product Revenues

Analyze revenue and GPT costs by lease and product for Texas, North Dakota, and New Mexico.

  • • Revenue calculations by lease/product
  • • GPT cost analysis
  • • TX, ND, NM coverage
  • • Lease-level tracking
View revenues
Premium Plan
🏭

Vendor Costs

Track and analyze vendor costs across different service categories in the Permian Basin.

  • • Vendor performance metrics
  • • Cost trend analysis
  • • Service category breakdown
  • • Permian Basin focus
Analyze vendors
Premium Plan
📋

Template Well Cost

Filter and use existing operator costs to create average well templates with all components.

  • • Operator-based cost filtering
  • • Average well cost calculation
  • • Component-level breakdown
  • • Template generation
Build template
Premium Plan
📊

SEC Financial Tables

Access comprehensive SEC financial data by company with detailed filtering and export capabilities.

  • • Company financial statements
  • • Period and form filtering
  • • Multiple statement types
  • • Export and copy functionality
View financials

Why AFE Leaks is different

AFEs + Actuals

Both planned and actual costs

Rapid Updates

Daily data updates, not quarterly or annual

Interactive Tools

Filter, analyze, and export in real-time

AFE Leaks Benchmarking Plus - Interactive Cost Analysis

See AFE Leaks in Action

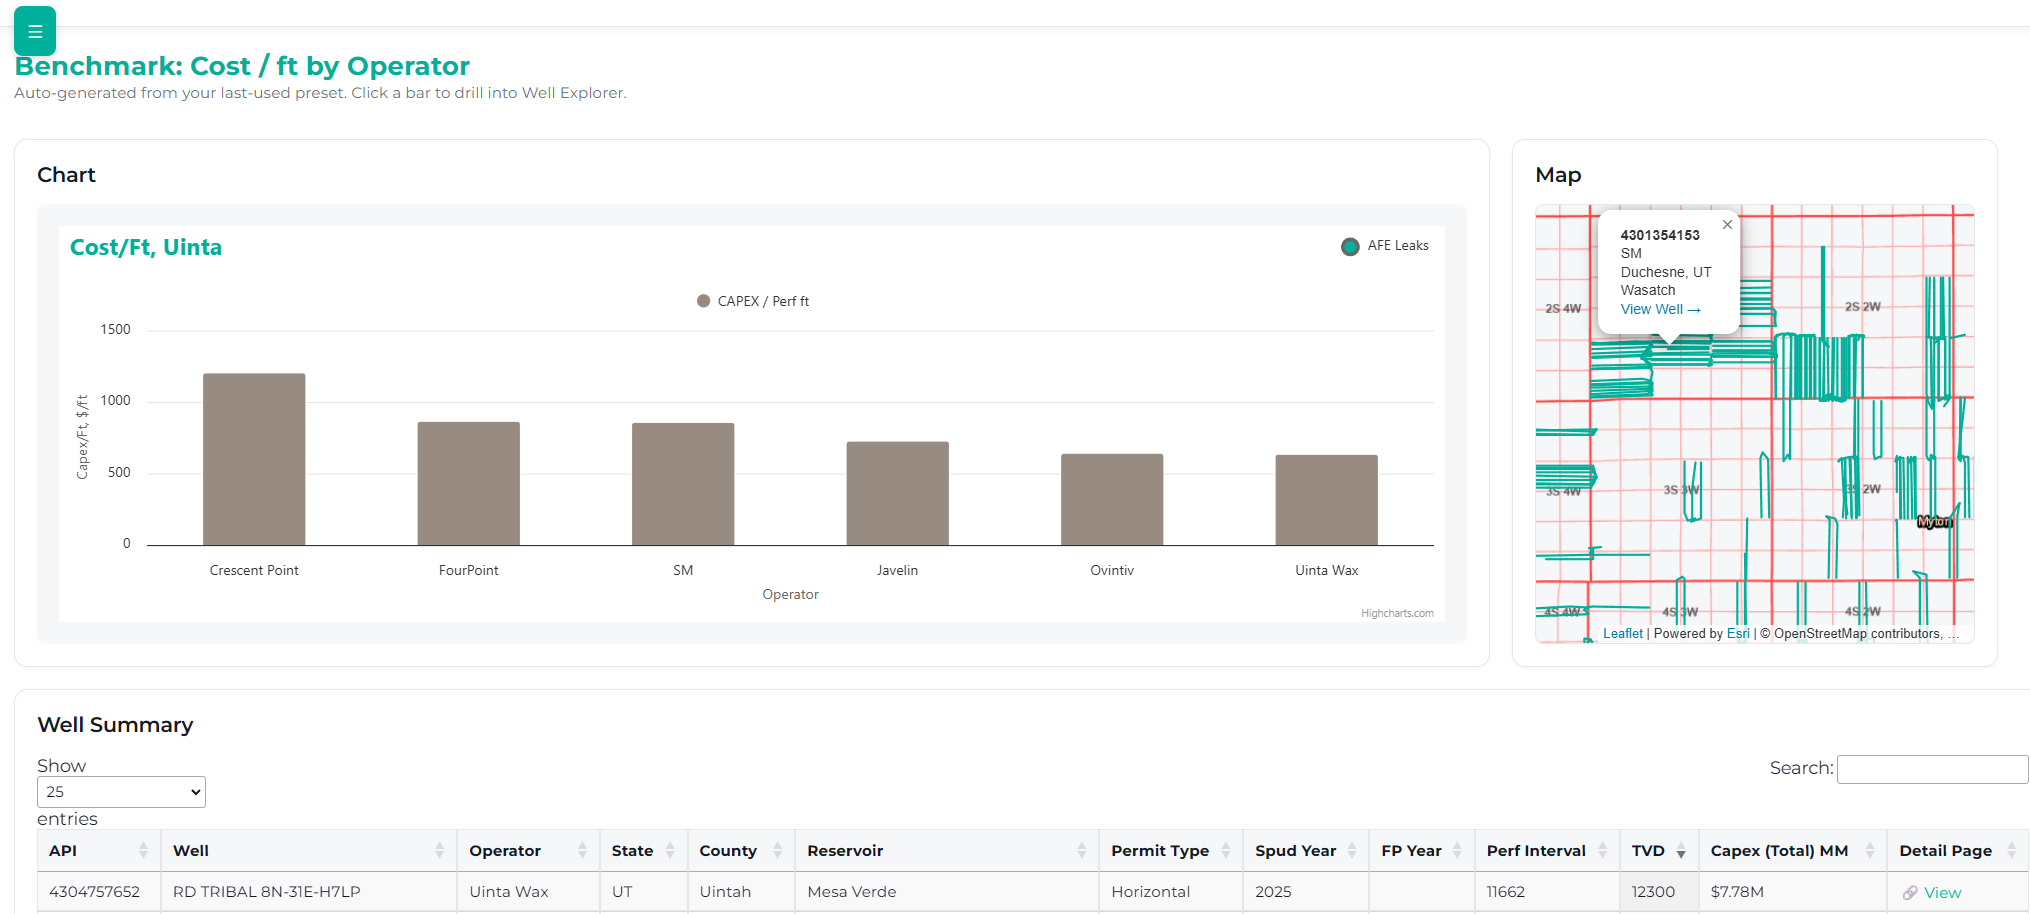
Interactive benchmarking with real-time cost comparisons and detailed analytics

Simple, transparent pricing

Choose the plan that fits your needs

Basic

$10 /month

or $100/year

  • Basic app access
  • Benchmark well costs
  • Access paid research
  • No single-well detail
Start Basic
Most Popular

Premium

$100 /month

or $1000/year

  • All Basic features
  • Single-well cost data
  • Detailed cost breakdowns
  • Outlier & savings analysis
  • AFE economics modeling
  • Product revenue tracking
  • Vendor cost analysis
  • Template well cost builder
  • SEC financial data access
  • Mass exports
Start Premium

Need data at scale, mass exports, or corporate features? Contact us for Corporate plans

Ready to optimize your well costs?

Join operators across the Lower-48 who trust AFE Leaks for their cost benchmarking and analysis.